介紹,安裝,編譯安裝,參數,使用,
介紹
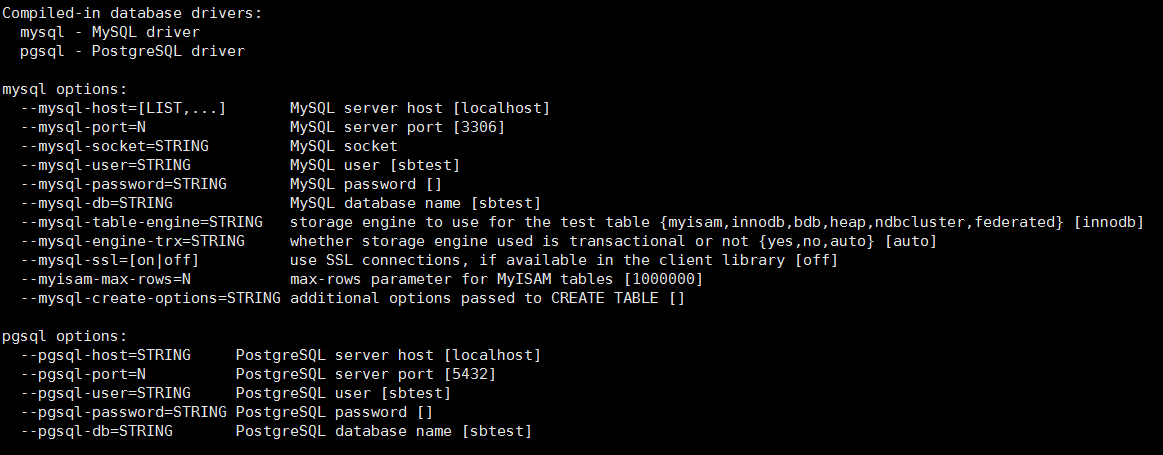
資料庫目前支持MySQL/Oracle/PostgreSQL。本文只是簡單演示一下幾種測試的用法,後續準備利用sysbench來對MySQL進行一系列的測試。具體的一些參數設定,需要根據不同的測試要求來進行調整。
安裝
編譯安裝
默認支持MySQL,如果需要測試Oracle/PostgreSQL,則在configure時需要加上–with-oracle或者–with-pgsql參數
./configure --prefix=/u01/sysbench --with-mysql-includes=/opt/mysql/include/mysql --with-mysql-libs=/opt/mysql/lib/mysql
make && make install
參數
NinGoo:/u01/sysbench/bin>$sysbench
Missing required command argument.
Usage:
sysbench [general-options]... --test=[test-options]... command
General options:
--num-threads=N number of threads to use [1]
--max-requests=N limit for total number of requests [10000]
--max-time=N limit for total execution time in seconds [0]
--forced-shutdown=STRING amount of time to wait after
--max-time before forcing shutdown [off]
--thread-stack-size=SIZE size of stack per thread [32K]
--init-rng=[on|off] initialize random number generator [off]
--test=STRING test to run
--debug=[on|off] print more debugging info [off]
--validate=[on|off] perform validation checks where possible [off]
--help=[on|off] print help and exit
--version=[on|off] print version and exit
Compiled-in tests:
fileio - File I/O test
cpu - CPU performance test
memory - Memory functions speed test
threads - Threads subsystem performance test
mutex - Mutex performance test
oltp - OLTP test
Commands: prepare run cleanup help version
See 'sysbench --test=help' for a list of options for each test.
使用
CPU測試
sysbench採用尋找最大素數的方式來測試CPU的性能
NinGoo:/u01/sysbench/bin>$sysbench --test=cpu --cpu-max-prime=2000 run
sysbench 0.4.12: multi-threaded system evaluation benchmark
Running the test with following options:
Number of threads: 1
Doing CPU performance benchmark
Threads started!
Done.
Maximum prime number checked in CPU test: 2000
Test execution summary:
total time: 2.3996s
total number of events: 10000
total time taken by event execution: 2.3917
per-request statistics: min: 0.23ms
avg: 0.24ms max: 27.44ms
approx. 95 percentile: 0.24ms
Threads fairness:
events (avg/stddev): 10000.0000/0.00
execution time (avg/stddev): 2.3917/0.00
執行緒測試
NinGoo:/u01/sysbench/bin>$sysbench --test=threads --num-threads=64 --thread-yields=100 --thread-locks=2 run
sysbench 0.4.12: multi-threaded system evaluation benchmark
Running the test with following options:
Number of threads: 64
Doing thread subsystem performance test
Thread yields per test: 100 Locks used: 2
Threads started!
Done.
Test execution summary:
total time: 4.3925s
total number of events: 10000
total time taken by event execution:280.4418
per-request statistics:
min: 0.04ms
avg: 28.04ms
max: 72.81ms
approx. 95 percentile:52.29ms
Threads fairness:
events (avg/stddev): 156.2500/1.43
execution time (avg/stddev): 4.3819/0.01
檔案IO性能測試
首先生成需要的測試檔案,檔案總大小300M,16個並發執行緒,隨機讀寫模式。執行完後會在當前目錄下生成一堆小檔案。
NinGoo:/u01/sysbench/bin>$sysbench --test=fileio --num-threads=16 --file-total-size=300M --file-test-mode=rndrw prepare
sysbench 0.4.12: multi-threaded system evaluation benchmark
128 files, 2400Kb each, 300Mb total
Creating files for the test...
執行測試
NinGoo:/u01/sysbench/bin>$sysbench --test=fileio --num-threads=16 --file-total-size=300M --file-test-mode=rndrw run
sysbench 0.4.12: multi-threaded system evaluation benchmark
Running the test with following options:
Number of threads: 16
Extra file open flags: 0
128 files, 2.3438Mb each
300Mb total file size
Block size 16Kb
Number of random requests for random IO: 10000
Read/Write ratio for combined random IO test: 1.50
Periodic FSYNC enabled, calling fsync() each 100 requests.
Calling fsync() at the end of test, Enabled.
Using synchronous I/O mode
Doing random r/w test
Threads started!
Done.
Operations performed: 5996 Read, 4004 Write, 12800 Other = 22800 Total
Read 93.688Mb Written 62.562Mb Total transferred 156.25Mb (26.713Mb/sec) 1709.66 Requests/sec executed
Test execution summary:
total time: 5.8491s
total number of events: 10000
total time taken by event execution: 12.5045
per-request statistics:
min: 0.01ms
avg: 1.25ms
max: 373.28ms
approx. 95 percentile: 0.03ms
Threads fairness:
events (avg/stddev): 625.0000/109.60
execution time (avg/stddev): 0.7815/0.29
清理現場
NinGoo:/u01/sysbench/bin>$sysbench --test=fileio --num-threads=16 --file-total-size=300M --file-test-mode=rndrw cleanup
sysbench 0.4.12: multi-threaded system evaluation benchmark
Removing test files...
Mutex測試
NinGoo:/u01/sysbench/bin>$sysbench --test=mutex --num-threads=16 \--mutex-num=1024 --mutex-locks=10000 --mutex-loops=5000 run
sysbench 0.4.12: multi-threaded system evaluation benchmark
Running the test with following options:
Number of threads: 16
Doing mutex performance test
Threads started!
Done.
Test execution summary:
total time: 1.1561s
total number of events: 16
total time taken by event execution: 18.3831
per-request statistics:
min: 1084.60ms
avg: 1148.94ms
max: 1153.52ms
approx. 95 percentile:10000000.00ms
Threads fairness:
events (avg/stddev): 1.0000/0.00
execution time (avg/stddev): 1.1489/0.02
記憶體測試
NinGoo:/u01/sysbench/bin>$sysbench --test=memory --num-threads=16 --memory-block-size=8192 --memory-total-size=1G run
sysbench 0.4.12: multi-threaded system evaluation benchmark
Running the test with following options:
Number of threads: 16
Doing memory operations speed test
Memory block size: 8K
Memory transfer size: 1024M
Memory operations type: write
Memory scope type: global
Threads started!
WARNING: Operation time (0.000000) is less than minimal counted value, counting as 1.000000
WARNING: Percentile statistics will be inaccurate
Done.
Operations performed: 131072 (114162.68 ops/sec)
1024.00 MB transferred (891.90 MB/sec)
Test execution summary:
total time: 1.1481s
total number of events: 131072
total time taken by event execution: 16.0448
per-request statistics:
min: 0.00ms
avg: 0.12ms
max: 3.60ms
approx. 95 percentile:0.01ms
Threads fairness:
events (avg/stddev): 8192.0000/192.89
execution time (avg/stddev): 1.0028/0.00
MySQL資料庫測試
首先需要創建默認的sbtest資料庫,或者使用–mysql-db指定一個已經存在的資料庫生成測試數據,引擎為myisam,表大小為1000000條記錄
NinGoo:/u01/sysbench/bin>$sysbench --test=oltp --mysql-table-engine=myisam --oltp-table-size=1000000 --mysql-user=root --mysql-socket=/opt/mysql/run/mysql.sock prepare
sysbench 0.4.12: multi-threaded system evaluation benchmark
No DB drivers specified, using mysql
Creating table 'sbtest'...
Creating 1000000 records in table 'sbtest'...
執行測試
NinGoo:/u01/sysbench/bin>$sysbench --test=oltp --mysql-table-engine=myisam --oltp-table-size=1000000 --mysql-user=root --mysql-socket=/opt/mysql/run/mysql.sock run
sysbench 0.4.12: multi-threaded system evaluation benchmark
No DB drivers specified, using mysql
Running the test with following options:
Number of threads: 1
Doing OLTP test.
Running mixed OLTP test
Using Special distribution (12 iterations, 1 pct of values are returned in 75 pct cases)
Using "LOCK TABLES WRITE" for starting transactions
Using auto_inc on the id column
Maximum number of requests for OLTP test is limited to 10000
Threads started!
Done.
OLTP test statistics:
queries performed:
read: 140000
write: 50000
other: 20000
total: 210000
transactions: 10000 (336.64 per sec.)
deadlocks: 0 (0.00 per sec.)
read/write requests:190000 (6396.11 per sec.)
other operations: 20000 (673.27 per sec.)
Test execution summary:
total time: 29.7056s
total number of events: 10000
total time taken by event execution: 29.6301
per-request statistics:
min: 2.27ms
avg: 2.96ms
max: 43.88ms
approx. 95 percentile: 3.36ms
Threads fairness:
events (avg/stddev): 10000.0000/0.00
execution time (avg/stddev): 29.6301/0.00
清理現場
NinGoo:/u01/sysbench/bin>$sysbench --test=oltp --mysql-table-engine=myisam --oltp-table-size=1000000 --mysql-user=root --mysql-socket=/opt/mysql/run/mysql.sock cleanup
sysbench 0.4.12: multi-threaded system evaluation benchmark
No DB drivers specified, using mysql
Dropping table 'sbtest'...
Done.

