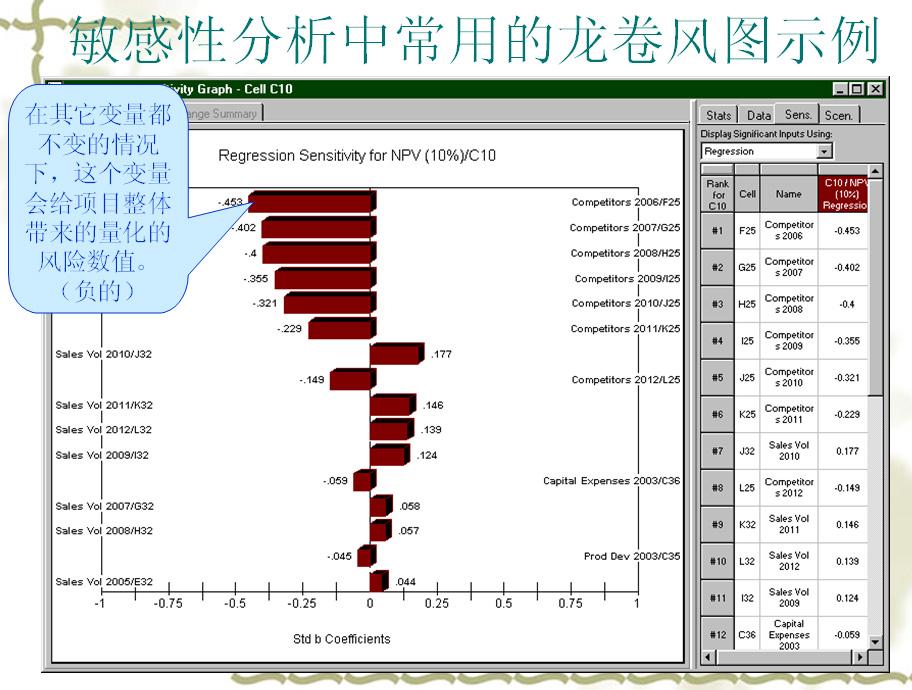
龍捲風圖:是項目管理中用於在風險識別和定性分析之後,進行定量風險分析的技術----敏感性分析技術中最常用的一種圖表技術。
基本介紹
- 中文名:龍捲風圖
- 龍捲風圖:項目管理中用於在風險識別
- 敏感性分析:敏感性分析有助於
- 定義:敏感性分析是一個主要的建模工具
影響,案例,敏感性分析的定義,其他案例,1)選擇參數,2)設定範圍,3)敏感性測試,4)將各敏感參數,
影響
敏感性分析:敏感性分析有助於確定哪些風險對項目具有最大的潛在影響。它把所有其他不確定因素保持在基準值的條件下,考察項目的每項要素的不確定性對目標產生多大程度的影響。
敏感性分析最常用的顯示方式是龍捲風圖。
龍捲風圖有助於比較具有較高不確定性的變數與相對穩定的變數之間的相對重要程度。
它因其顯示形式像龍捲風一樣而得名。圖例請見圖片。
案例
龍捲風的解釋,並且給出了圖例:
Sensitivity analysis is a primary modeling tool that can be used to assist in valuing individual risks, which is extremely valuable in risk management and risk allocation support. A "tornado diagram" is a useful graphical tool for depicting risk sensitivity or influence on the overall variability of the risk model. Tornado diagrams graphically show the correlation between variations in model inputs and the distribution of the outcomes; in other words, they highlight the greatest contributors to the overall risk.
The tornado diagram has a central vertical axis from which bars extend left and right, their length corresponding to the influence of the factors they represent on risk. The bars are ordered so that they decrease in influence as they go down.
敏感性分析的定義
敏感性分析是一種可用於評估個體風險的主要的建模工具,它對於風險管理和風險分擔的支持非常有價值。而龍捲風圖是一個很有用的圖形化工具,用於描述風險模型整體可變性中的風險敏感性或風險影響。龍捲風圖以圖形化方式顯示模型中輸入的變化和輸出結果的分布之間的關聯;換句話說,它強調了整體體風險最大的促成因素。
龍捲風圖有一個中心縱軸和一系列向左右伸展的橫條,橫條長度對應於它們所代表的風險因素的影響。橫條按降序排列,代表風險因素的影響力逐漸下降。
Sensitivity analysis is a primary modeling tool that can be used to assist in valuing individual risks, which is extremely valuable in risk management and risk allocation support. A "tornado diagram" is a useful graphical tool for depicting risk sensitivity or influence on the overall variability of the risk model. Tornado diagrams graphically show the correlation between variations in model inputs and the distribution of the outcomes; in other words, they highlight the greatest contributors to the overall risk.
The tornado diagram has a central verticalaxisfrom which bars extend left and right, their length corresponding to the influence of the factors they represent on risk. The bars are ordered so that they decrease in influence as they go down.
The tornado diagram has a central verticalaxisfrom which bars extend left and right, their length corresponding to the influence of the factors they represent on risk. The bars are ordered so that they decrease in influence as they go down.
 龍捲風圖片
龍捲風圖片其他案例
托那多圖(Tornado Diagram) 是敏感性分析中非常有效的常用圖示,它將各敏感參數按其敏感性進行排序,形象地反映出各敏感參數對價值評估結果的影響程度。運用托那多圖進行敏感性分析的具體步驟包括:
1)選擇參數
:在完成模型構建後,對各參數進行基本測試(包括各元素最大可能情況下的取值及可能對價值結構的影響),選擇一組可能對評估結果產生重要影響主要參數作為進行敏感性測試的變數;
2)設定範圍
:為每個參數設定一個合理的可能變動範圍;
3)敏感性測試
:? 保持其他參數不變,只變動其中一個參數,如果估算結果出現明顯波動,確認該參數為敏感參數;對每一因素進行測試,並將每一敏感參數發生可能的波動時相對應的評估結果記錄下來;

